 TrueNAS CORE
 TrueNAS Enterprise
 TrueNAS SCALE
 TrueCommand
 Compare Editions
 Software Status
 FreeNAS
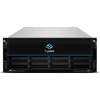 M-Series
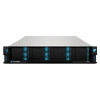 X-Series
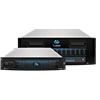 R-Series
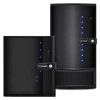 Mini Series
Main Dashboard
6 minute read.
Last Modified 2022-11-15 15:53 -0500The Dashboard screen displays the first time you log into the SCALE web interface. To display the Dashboard screen again click Dashboard on the left side panel.

The Dashboard displays basic information about your TrueNAS system in widgets or information cards that group information about your TrueNAS by type. For example, CPU information in the CPU widget. These widgets display in a default layout that you can change.
Use the Reorder button to change the layout of the various widgets to suit your preference.
Use Configure turn the widget display on or off. When on the widget displays on the dashboard.
The Dashboard Configuration panel allows you to turn widget displays on or off. There are three widget group types, System Widgets, Storage Widgets and Network Widgets. Storage and network widgets vary based on the pools and network interfaces configured on your TrueNAS.

Click on the slider to turn the information display on or off.
System Widgets control the display of the System Information, CPU, Memory and Help widgets.
Storage Widgets control the display of the Storage widget and individual widgets for each pool configured on your TrueNAS.
Network Widgets control the display of the Network widget and any individual interfaces configured on your TruNAS.
Use Save to retain any setting changes you make. Click on the X or on any part of the UI screen away from the Dashboard Configuration panel to close it without saving changes.
Click on the icon to display the report screen that corresponds to that widget. For example, clicking the icon on the CPU widget opens the Reports > CPU screen.
The System Information widget displays general information on the SCALE system.
If installed on customer-provided servers the widget displays a generic TrueNAS image. If installed on iXsystems-provided hardware, a picture of the iXsystems hardware displays on the card above the Updates Available button. Click on the image to display the System Enclosure screen.


| Field | Description |
|---|---|
| Platform | Displays Generic for customer-provided server and hardware, and a TrueNAS logo displays to the left of the System Information fields. Displays the TrueNAS model number for the iXsystems-provided server and hardware, and a picture of the server displays in the area to the left of the fields. |
| Version | Displays the currently-installed software release of TrueNAS SCALE. Use the clipboard icon to display the full name of the release installed and to copy the version to the clipboard. |
| HostName | Displays the host name for the TrueNAS system. Configure the host name i on the Network > Global Configuration screen. |
| Uptime | Displays the number of consecutive days and the number of hours and minutes the system has run since the last reboot. |
| Updates Available | Click to display the System Update screen. You can also display the System Update screen by selecting System > Updates on the main menu panel on the left side of the screen. |
The CPU widget displays information on the system CPU.
The widget includes an Avg Usage dynamic spinner that displays the percentage of usage at that moment on the CPU. The Stats Per Thread bar graph displays Usage in blue and Temperature in orange with the x axis with the number threads and the y axis the percent usage in 20 increment counts. It also details the number Cores as x cores (y threads), the Highest Usage as x% (y threads at x%), and the Hottest temperature as x°C (y cores at x°C).

The Memory widget displays information on the system memory.
The widget displays a spinner showing the GiB Free in blue, ZFS Cache in fuchia pink, and Services in orange.

The Network widget displays network the status of the system interfaces, I/O stats, link status and the system IP address and port number.
The Network widget displays a dynamic graph of input (blue) and output (orange) I/O activity over the primary system interface.

If more than one interface is configured on your TrueNAS you can use the Dashboard Configuration panel to add an interface widget for each interface. The Interface card displays the information for that interface.

Click on the to display the Addresses widget for that interface.

Click the to display the Network screen where you can select the interface to open the Edit Interface panel.
The Storage widget displays information on the root and other storage pools configured on your system.
The Storage widget displays the root pool status, path, and the number of vdevs configured. It also displays the percentage of space it uses, is free and any caches. It also reports on the number disks with errors, the total number of disks the root pool uses and if a spare exists.

The individual pool information displayed in this widget includes the same information as the root pool.
The Pool widget displays information on a single storage pool.
You can use the Dashboard Configuration panel to add a pool widget for each pool you want to include on the Dashboard. The Pool widget displays the total number of disks, pool status and space used by the pool this widget reports on. It also provides the mount path, available space, number of data vdevs, caches, spares and logs configured for this pool.

Click on the icon to display the Storage > Pool Status screen.
Click on the to display the details on the vdevs.

The TrueNAS Help widget displays links to the TrueNAS Documentation Site and community forums, as well as a link to where users can sign up for the TrueNAS Newsletter and a link to the Github web page for TrueNAS open source software.

Click on each link to open it in a new browser tab.