 TrueNAS CORE
 TrueNAS Enterprise
 TrueNAS SCALE
 TrueCommand
 Compare Editions
 Software Status
 FreeNAS
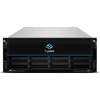 M-Series
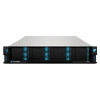 X-Series
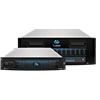 R-Series
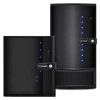 Mini Series
Reporting
2 minute read.
Last Modified 2022-10-10 09:43 -0400TrueNAS has a built in reporting engine that displays helpful graphs and information about the system processes. TrueNAS uses Graphite for metric gathering and visualizations.
Configure system reporting on the System > Reporting screen.

General Options
| Name | Description |
|---|---|
| Report CPU usage in Percent | Reports CPU usage in percent instead of units of kernel time. |
| Graphite Separate Instances | Sends the plugin instance and type instance to Graphite as separate path components: host.cpu.0.cpu.idle. Disabling sends the plugin and plugin instance as one path component and type and type instance as another: host.cpu-0.cpu-idle. |
| Remote Graphite Server Hostname | Remote Graphite server host name or IP address. |
| Graph Age in Months | Maximum time (in months) TrueNAS stores a graph. Allowed values are 1-60. Changing this value causes the Confirm RRD Destroy dialog to display. Changes do not take effect until TrueNAS destroys the existing reporting database. |
| Number of Graph Points | The number of points for each hourly, daily, weekly, monthly, or yearly graph. Allowed values are 1-4096. Changing this value displays the Confirm RRD Destroy dialog. Changes do not take effect until TrueNAS destroys the existing reporting database. |
| Reset to Defaults | Resets all entered values and settings back to defaults. |
Report history is cleared after changing and saving CPU reporting, graph age, or graph points.
For information on the Reporting screen graphs see System Reporting.
Reporting data is saved and preserved across system upgrades and reboots.
This allows viewing usage trends over time.
This data is frequently written and should not be stored on the boot pool or operating system device.
Reporting data is saved in