Configuring Reporting
2 minute read.
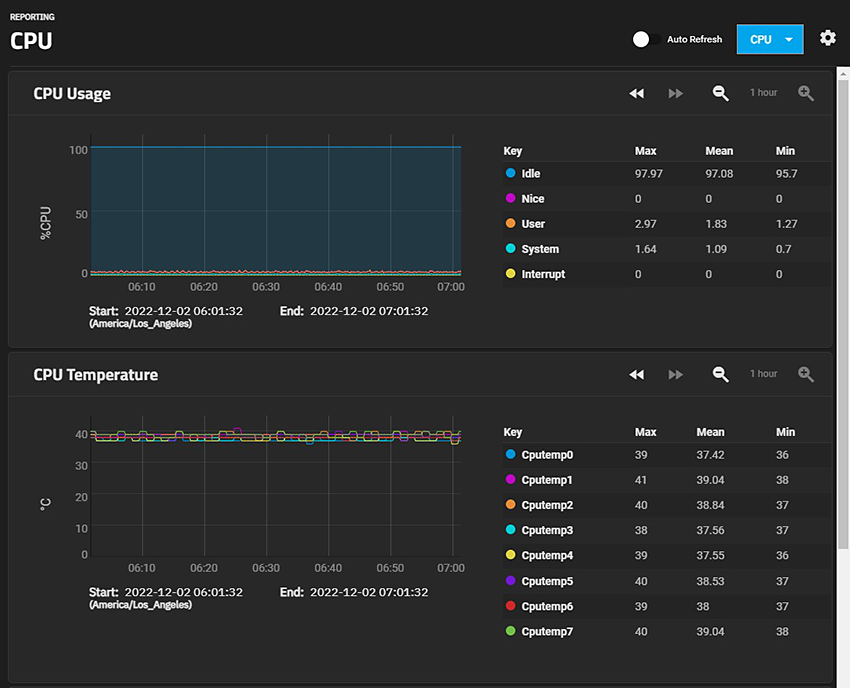
Last Modified 2022-12-02 12:30 -0500TrueNAS has a built-in reporting engine that provides helpful graphs and information about the system.

Reporting data is saved to permit viewing and monitoring usage trends over time. This data is preserved across system upgrades and restarts.
Because reporting data is written frequently do not store it on the boot pool or operating system device.
TrueNAS clears the report history when you change the report CPU, graph age, or graph points options.
Data files are saved in
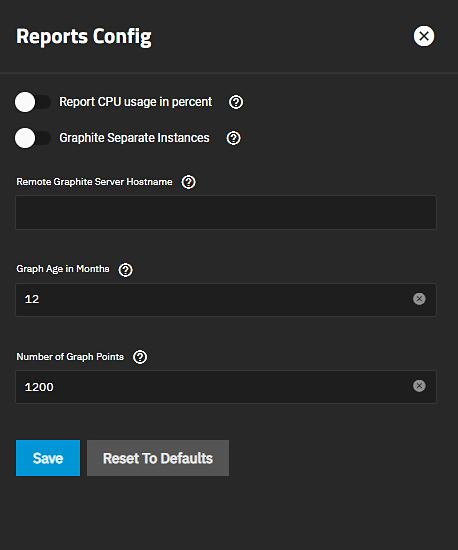
Click the settings to open the Reports Configuration configuration screen where you control how TrueNAS displays the graphs.

Select the general options you want to use in your TrueNAS.
Specify either the host name or IP address of the Graphite server you want to use.
Click Save.
To increase TrueNAS reporting functionality connect it to our TrueCommand multi-system management software.
TrueCommand Reports offer enhanced features like creating custom graphs and comparing utilization across multiple systems.
Click on and drag a certain range of the graph to expand the information displayed in that selected area in the Graph. Click on the icon to zoom in on the graph. Click on the icon to zoom out on the graph. Click the to move the graph forward. Click the to move the graph backward.

